The Amish Population Has Doubled Since 2000 – Now Exceeds 350,000
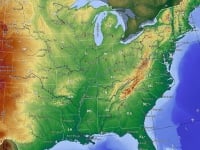 As it does around this time each year, the Young Center at Elizabethtown College has just published its Amish population estimates for 2020 (update: see the latest 2022 numbers here). The total estimated Amish population is 350,665, found in 31 states, four Canadian provinces, and two South American countries. Some interesting takeaways from the figures:
1. Four Large Settlements. The largest settlement, Lancaster County, now has an estimated Amish population of 40,525. Not far behind is the Holmes County community at 36,955. The third largest settlement, Elkhart & LaGrange Counties, Indiana (26,380), is actually closer in size to the fourth most sizeable, Geauga County, Ohio (18,820), than it is to Holmes County.
These four large communities account for 35% of the total Amish population, with the remaining 585 settlements accounting for 65%. To put it another way, if you meet a random Amish person, there is about a 1 in 3 chance he or she lives in one of the four largest communities.

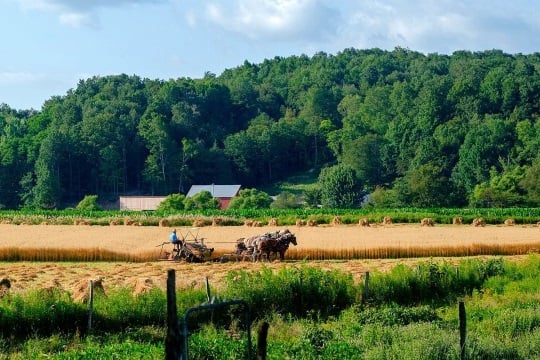
Geauga County, Ohio. Photo by SI
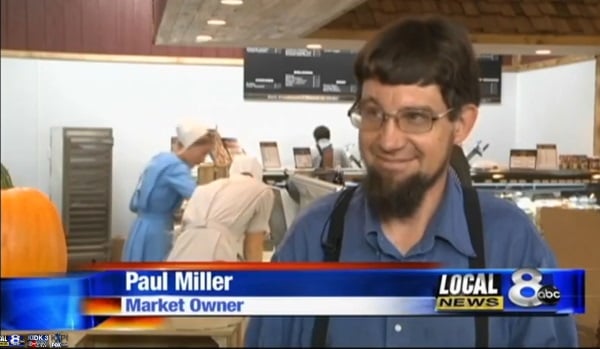
2. New Locations. As is the trend, the Amish continue settling in new locations. The Center’s population summary page notes that 33 new settlements have been founded since the last tally, with seven settlements ceasing to exist, for a net gain of 26 settlements.
3. Most Amish communities are small. Fifty percent of all settlements are just a single church district in size. A church district can range from a handful of households, to over 50 or 60 in rare cases, but usually number about 20-40 families in size.

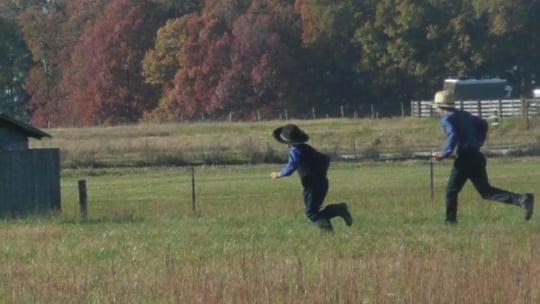
Union Grove, NC
4. 97% growth since 2000. The Amish population has increased from an estimated 177,885 in 2000 to 350,665 in 2020. This gain of 172,780 means the Amish population has essentially doubled since the turn of the century, a growth rate of 97% over two decades.
5. Fast & Slow Growers. Some states have proven more attractive to Amish than others. States which outpaced this rate of growth in the 2000-2020 time period include Missouri (165% growth), Kentucky (180%), New York (371%), and Minnesota (234%).
States which notably lagged behind include Ohio (61% growth), Pennsylvania (83%), Maryland (62%) and Indiana (81%). The main reason for these growth differences is migration, due to factors including land prices and a desire to live in less densely-populated areas.

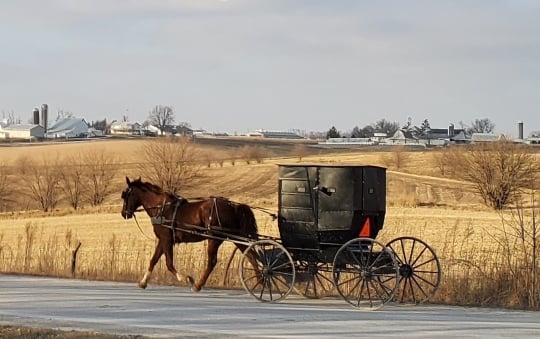
Jamesport, MO. Photo by Don Burke
Where do the figures come from? As always they are based on a number of sources. From the Amish Studies site:
Population estimates for 2020 were calculated using a variety of sources including Raber’s New American Almanac, reports by correspondents in Die Botschaft, The Budget, and The Diary, settlement directories, regional newsletters, and settlement informants. The data includes all Amish groups that use horse-and-buggy transportation, but excludes car-driving groups such as the Beachy Amish and Amish Mennonites.
The figures were compiled (no small task) by a three-person team:
Statistics compiled by Edsel Burdge, Jr., Young Center for Anabaptist and Pietist Studies, Elizabethtown College, in cooperation with Joseph F. Donnermeyer, School of Environment and Natural Resources, The Ohio State University, and with assistance from David Luthy, Heritage Historical Library, Aylmer, Ontario.
You can find the full population tables here, the 2000-2020 population change charts here, and the list of twelve largest settlements here.

Thanks.
Just want to register my appreciation for your postings. Good to be kept up-to-date, without being flooded.
Gladly, Robert. I’m actually posting more now since March and the lockdowns etc. began. I hope people get value from these posts, but I guess those who find it a flood can always unsubscribe or ignore:)
thank you for posting
New York?
I was surprised by some of the states that the Amish are moving to, especially New York. You mean to tell me that they can find cheaper land in New York then in Ohio? What a surprise that was to hear.
Mary,
New York is a pretty large state by eastern standards, being about 10,000 sq miles bigger than Ohio. Plus, Ohio’s population is more dispersed throughout the state. NY has 19.4 million people, but nearly 8.5 million live in the 305 sq miles of NYC. Another 7.7 million live on 1,377 sq miles in Long Island. Outside the cities such as Buffalo, Rochester, Albany, Syracuse, etc…. much of the rest of NY is rural. A lot of farmland available. Even more farmland the further north you go. Most Amish seem to have moved to the western part of upstate. In my opinion, NY is far more suitable for the Amish than either Ohio or Pennsylvania, though both those states are also suitable. Development in NY never really touched upstate (central, northern, and western) outside those cities, whereas in PA and Ohio development has been a common pressure over the last 30-yrs. Both Ohio and Pennsylvania still have plenty of farmland. It’s just that in Pennsylvania’s case, the Amish live in a growing and dense area. Western and central PA is still very suitable for the Amish. A lot of counties in central PA are losing population, especially in rural areas.
Amish in Ireland
Hi Erik, thanks very much for your post. I was just wondering why there is never any mention of the Amish in Ireland. I believe there used to be Amish in Australia as well, but maybe I am mistaken.
Sure thing Ivan. As far as Old Order Amish (horse-and-buggy), there are not any communities outside of the US, Canada, Bolivia and Argentina. But there are Beachy Amish communities and some other similar groups. Ireland is home to Beachy Amish.
There was also a report on the Amish-esque group in Australia. https://amishamerica.com/amish-in-australia/
And just the past week there was an article out on Bruderhof in the UK. https://metro.co.uk/2020/08/13/what-bruderhof-believe-where-community-live-uk-13125057/
The numbers we cover in these reports are strictly Old Order Amish, so wouldn’t include any of those groups.
Ivan,
The Beachy Amish are not exactly what you would call Amish. They are more a evangelical church, rather than a traditional Amish community. Many of their members do have roots in the Amish, but just as many have no historical roots in the Amish community. The Beachy Amish broke away from the Amish nearly 100-yrs ago.
In Europe
Indeed, in Europe, the only “Amish” populations are beachy Amish. To make a little tour of horison, there was an attempt to settle beachy on the original lands in Alsace (France) between the years 1980 and 1985. The local people did not understand that this movement was more liberal and not of the old order, which frightened some of having to ride on horseback and those who thought they were living as in the 17th century did not appreciate being able to have a car anyway. I quickly summed it up, other factors still came into play. In any case, only about thirty people have done so and only 3 baptisms have been made. I don’t know what happened to these 3 people?
Another mission also appeared in 1980 in Poperinge in Belgium, but the mission closed in 2008.
In Poland a family had settled, the population initially took them for Orthodox Jews.
In Ireland, the Waterford Amish Mennonite community (also Beachy) still seems to be doing well today.
It looks like Beachy communities are still established in Ukraine and Romania as well, but I don’t know more.
On the other hand, there are about 58,000 Mennonites in Europe, but I challenge you to recognize them when you cross them in the street, so that no distinctive sign distinguishes them from the other inhabitants.
Posting Flood
I wouldn’t exactly call your postings a flood. I can’t imagine anyone wanting to unsubscribe. It’s nice to see the Amish population growing as they contribute so much to an area.
Good to hear that Randy. I get a ton of emails myself from various lists I’ve subscribed to (and even some that I haven’t 🙂 ) so I get what an overfull email inbox is like. Lately I’ve liked to do daily posts (weekdays primarily). But always trying to cover relevant and interesting content. Reader suggestions are always welcome – for instance yesterday’s post on the Belize Mennonite documentary came from a reader pointing it out to me, which is great.
Most Amish Don't Use Birth Control
Thanks for sharing the interesting article, Erik! Since most Amish don’t use birth control, the #’s didn’t surprise me.
Sure – yes and I expect that practice (non-practice?) won’t be changing too drastically. Though the family sizes can definitely vary across communities, which is interesting. An Amish Paradox and Plain Diversity are two books which have some interesting numbers on that topic.
Thanks for sharing, Erik!
Thanks for sharing, Erik? Book titles sound interesting as well.
I wonder what affect the virus will have on the Amish in the short term. My view is that it will make the Amish more conservative in the short term. This probably won’t be true for the general population, which will be more isolated with young people less likely to find a spouse and spending more time playing video games or posting to Tiktok. The general population won’t be as inclined to start a family or in many cases just “hook up”.
For the Amish I bet it will be the opposite. The virus will probably mean more austere household planning. A lot of Amish are affected by the lack of tourism and other industries, so many Amish families will become more austere, but austere doesn’t necessarily mean family planning. It may mean that many Amish, especially in the more wealthy communities are not going to be spending less on consumer goods and going to the zoos and aquarium (you see a lot in Philadelphia). They will likely spend more time at home with family reinforcing the importance of family time and community. Plus, the lack of tourist influences even for a short time will likely have some impact on Amish culture, especially in the more open communities.
Amish Growth
Their population has certainly grown around this area of SW Wisconsin. Now if they would support our country and communities and take some pride in living in a nation that grants them the freedom and liberty to do as they please it would be better.
They could also start policing up the horse crap on our roads as well. Several times a sheriff has stopped by my farm when I have spilled a bit out of the manure spreader. But here again, a double standard.
Also they are not shy about contacting your landlords and offering more money for getting control of the land or driving the prices of land higher. Every time for the last 20 years that a fella with a hat & beard shows up on my farm, he is looking for land. I have lost three rental farms because they offer to pay more rent. A lot more! Not once have they been considerate enough to tell me that they just made a drug deal and took the bread off my families table That is not loving your neighbor. It is grossly selfish and inconsiderate.
Jon,
It is obvious where you are coming from. You fear competition with the Amish. First of all, as someone who has worked in various trades in communities with Amish populations I often have to compete with them as well. So I understand that. The issue I take with your comment is that you are singling them out. The Amish are competing just like the non-Amish. If they didn’t have Amish clothes for you to single out you would still be complaining about them regardless of who they were because they are bringing competition to your area.
For someone who lives in a dying rural agricultural area like where you live, and who is used to getting cheap land at a undervalued price from older English farmers who can no longer work their land… seeing the Amish moving in and competing is probably a challenge for you and your family. So I sympathize, but the Amish are not at fault. They are trying to also feed their families. If they can rent land and successfully feed their families, then why can’t you? What is your problem? How can they pay rent for land at 3 times what you will pay (which is their right) and still afford to feed their families, but you cannot? What are you doing wrong and they are doing right to make the economics work for them? You should try to figure out those questions.
My assumption is that the answer to that question is that Amish are minimalists and are ok with living a normal farming life and accumulate their wealth over years, rather then expect every year to be a good year with good yields and ranting land from English at basement prices like you seem to expect. I bet the English land owners appreciate the Amish paying them more money then you. I also bet the local counties appreciate the Amish for bringing new taxes, businesses, and populations to the area.
Growth lower than in 2019?
Hi there Erik, interesting stats this year, the main question i have is that why there is so big of a change between the growth this year: 8,5K (+2.6%), versus the previous year, when it was around 11,3K or +3.5% in comparison to 2018. What would be the main reason of this sudden decrease (around -25%) in the population increase?
I’m not sure how accurate the Amish census is. I consistently see that certain communities are ignored. One such example is the Amish in northern Maryland which has grown a lot over the past 5-10 years, especially around Rising Sun. It is never mentioned in the reports as a community. I don’t know if they count it as a part of the Lancaster community or what, but it makes me wonder how many other communities aren’t being counted.
To be fair I understand that no census can be accurate and those making the census are doing it on their own and with limited resources that can be obtained through the publications and links they have with various entities and communities. It won’t always be 100% accurate.
The Spiritual Athlete
We put together The Spiritual Athlete in 1990 & I dedicated it to Joe & Marie Delagrange near Potsdam NY. Joe told my son who drew their portraits for the dedication page that he considered me one of his closest friends.The book was selected by The Library of Congress for Talking Books both in the US & Canada. If you email me I’ll send you reviews and more that may interest you.