76% of Cause-Reported Amish Buggy Crashes Are The Fault of Car Drivers, New Study Finds

A new report draws attention to a study which found that over 46% of crashes in the study set were caused by “motor vehicle driver error.”
Update: That is in all likelihood under-reporting the percentage, as Walter Boomsma points out in the first comment below. Headline has been accordingly updated, and hat-tip to Walter, who notes that when only considering the crashes where causes have been provided, the percentage attributable to motor vehicle driver error is much higher – 76%.
What fits in that category? Everything from speeding to impaired driving to “phone use”.
In contrast, errors by the horse-and-buggy side were cited in less than 10% of crashes.
Those include “Buggy driver error” (3.8%), “Horse error” (5.4%), and “Mechanical problem with buggy” (0.5%). The table below from the study, first published earlier this year in JPAC (Journal of Plain Anabaptist Communities) breaks the causes down further.
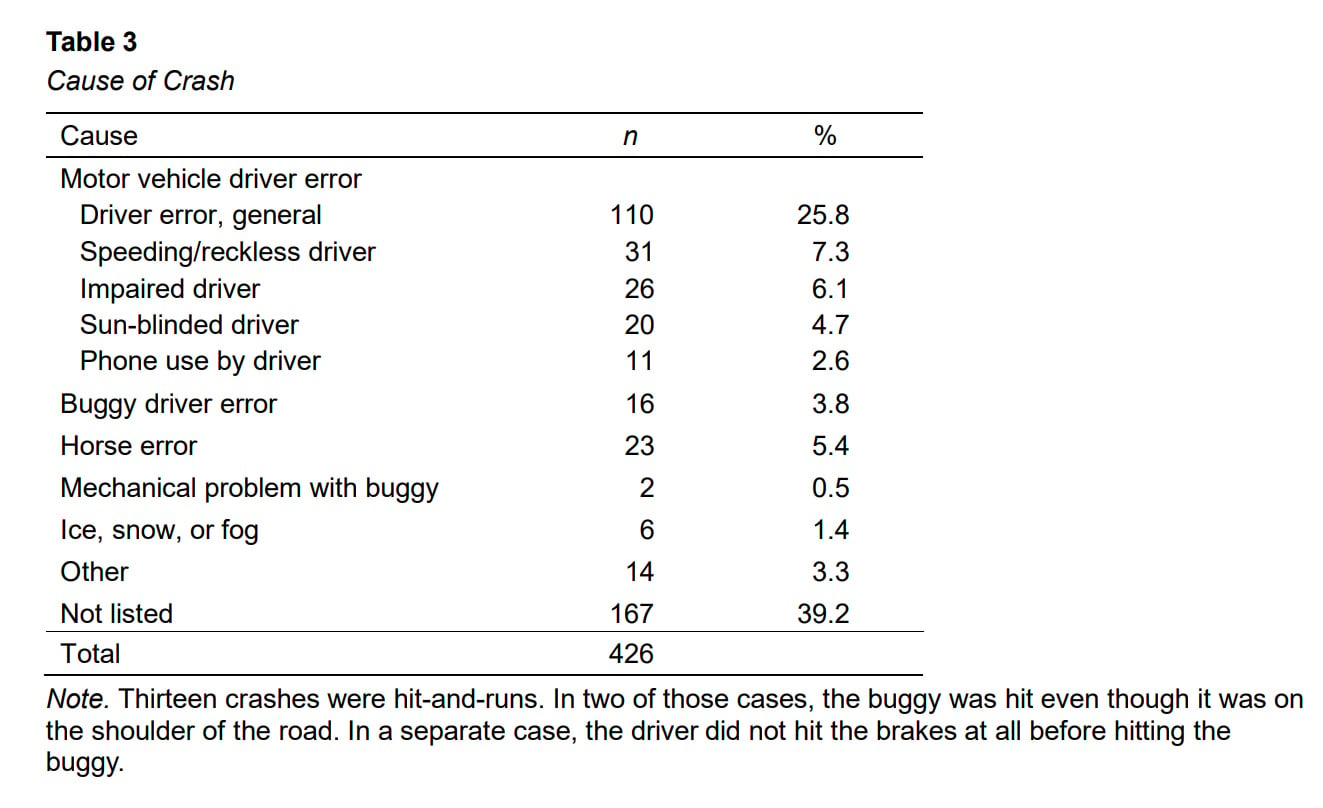
To compile this data, the authors Rachel Stein and Mark Dewalt used reports generated by the Amish in The Diary, one of a number of Plain correspondence papers which contains reports of news from various communities. They studied an eight-year period (2015 to 2022), and identified a total of 426 crashes involving a buggy.
Notably, a large chunk of crash reports – nearly 40% – had no cause attached to them. The authors address this in their article:
Using crash reports in The Diary allowed us to examine a broad scope of crashes, including those that resulted in minor or no injuries. However, our data is limited to what the scribes reported. Not all Amish communities have a scribe representative, and not all scribes who contribute to The Diary report on crashes.
Moreover, some scribes who report on crashes may have more information about the details of the crash than others, leading to uneven details across the scribe reports.
Even so, The Diary provides a rich and unique data source to explore buggy crashes, as it is not limited to severe injuries as are hospital reports or to police interpretations of the crash as are DOT reports.

Buggy Crash Fatality Rate “Far Exceeds” Car-Only Crashes
Perhaps unsurprisingly, the fatality rate is much higher in car-buggy crashes. Via an Lancaster Online report on the study:
The consequences of a buggy crash can be severe. According to the data collected by Dewalt, 19% of all crashes between a horse-and-buggy and a motor vehicle result in serious injuries and over 8% result in at least one death, which far exceeds the fatality rate among motor vehicle-only crashes.
According to the National Highway Traffic Safety Administration less than 1% of all vehicle crashes in 2024 were fatal.
So based on this comparison, that would mean crashes involving buggies are deadly over 8 times as often.
Insights from the Authors
The report offers additional commentary by the study authors. Mark Dewalt shared something that may – or may not – surprise you:
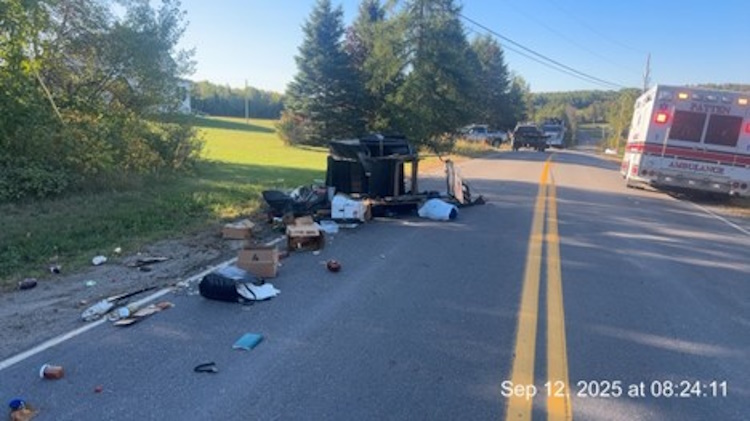
“Most buggies are hit in broad daylight on a straight road,” Dewalt said. “That’s usually the case. I think it’s because people in our culture aren’t concentrating on what they’re doing. I just got a new car, and there’s so many things that can distract my attention while I’m driving.”
Rachel Stein drew attention to another important factor – Amish buggies appearing in places where they have never been before: “As Amish communities grow, all of a sudden you have buggies on roads where people aren’t used to them.”
This is mainly due to Amish founding new settlements in places that have never seen Amish previously. But I also suppose that natural growth of existing communities can lead to Amish buggies traveling in new directions and on roads they haven’t ever much used before.
Ideas on How to Reduce Buggy Crashes
The authors also offer a number of suggestions that might help reduce accidents, focusing both on the motor vehicle side and the buggy side. First from the side of the buggy driver:
While less than 10% of the crashes reported in The Diary were attributed to buggy driver or horse error, educational materials on roadway safety might be pertinent to the Amish population (Eicher et al., 1997; Gorucu et al., 2017; Kinzenbaw, 2008), especially considering Amish children begin driving buggies at age 13 or 14 and may not have full knowledge of safe driving techniques (Eicher et al., 1997).
An emphasis on safety education in Amish schools might be particularly pertinent, but more comprehensive education is also relevant. Our results indicate wrecks where the Amish buggy driver is at fault are most likely broadside impacts, emphasizing the need for increased awareness by all buggy drivers. As Anderson (2014) notes, in some instances, buggy drivers have reduced visibility in intersections, as their driver’s seat sits farther back than the driver’s seat in motor vehicles.
As such, infrastructure changes might be an effective strategy to curb broadside crashes. Moreover, buggy drivers need to be aware of methods to regain control when a horse becomes spooked and of the need for a safety check of the harness before taking off in a buggy.
When it comes to the motor vehicle driver side, interestingly, among their suggestions they note that “Research suggests distributing tips for safe driving practices and sharing the road with slow-moving vehicles is particularly useful, especially for tourism facilitators (Dewalt & Bradley, 2013; Eicher et al., 1997; Grisso & Jepsen, 2020).”

They suggest that “Areas with high tourist traffic are one potential area of focus” and suggest distributing materials promoting awareness in hotels and other places where tourists appear.
I find that interesting because it is my own observation – based primarily on reports in online media (more on that below) that it is nearly always local residents, and not tourists, involved in buggy crashes. They also add two suggestions in their conclusion which we have seen some areas of the country
Implementing signage or flashing lights in areas with high buggy traffic and in regions that are newly experiencing buggy traffic, such as in areas with new settlements or where district growth has led to greater use of state roads, might bring awareness to motor vehicle drivers.
Even more effective would be infrastructure changes, including widening of roads, as currently exists in some areas with large Amish populations.
These bring to mind the innovative flashing light signage being installed and considered in Minnesota and Virginia, as well as buggy lanes added in places including Indiana and Ohio.
Does 46% “feel” right here?
If you asked me, before my having seen this study, how many buggy crashes were “faultable” to the motor vehicle driver, I’d probably guess a bit higher, maybe in the 60% ballpark.
However, I am seeing and covering mainly those buggy crashes which appear in online media. The authors looked at a different set of data, namely an Amish correspondence publication. That source is going to cover more accidents, perhaps a lot more.
And (as suggested by the authors) those reports which make online media I would suspect tend to be the more dramatic ones (though not always). By their nature, crashes involving a DUI or serious injury or hit-and-run cases where criminal liability might be involved are more apt to get news media coverage, than those without those factors.
If you’d like to read the full study, you will find it at the JPAC website here. The pdf of the study can be downloaded at that page.


Revised Headline
Let’s apply some survey logic. If this had been a survey, we could accurately report that of the 426 surveys sent out, 259 were returned.
Of the 259 accidents reporter, 76% (198) were caused by car drivers. 16% (41) were attributed to the buggy driver, horse, or mechanical issues with the buggy. 8% (16) were weather-related.
Now we have a valid headline. “76% of reported accidents were caused by car drivers.”
If we had data on the 167 that weren’t included, it would be reasonable to assume the pattern would be the same as it was with the 259.
That conclusion has what is sometimes called “face validity.” As written, the headline implies that the majority of accidents were not caused by car drivers.
I’m a bit of a data nerd.
Thank you Walter. I should have caught this and made the distinction. Good we have someone more statistically-inclined keeping an eye on things 😉 .
“According to a study published by University of West Virginia sociology professor Rachel Stein and Winthrop University professor emeritus Mark W. Dewalt, more than 46% of all horse-and-buggy crashes reported in a Lancaster County-based Plain-sect periodical were caused by motor vehicle driver error, including driver impairment, speeding, phone use or general error.”
The only thing I can say in defense of framing it using the 46% figure is it being a hyper-conservative approach of treating/reporting on the data – on the highly unlikely assumption that none of the remaining 167 unknown-cause crashes were caused by car drivers. But as I think your comment suggests, that would be improbable, and I would assume bordering on the statistically “impossible”.
I’ve revised the headline and hat-tipped you in an update above. Thanks!
Information acquirement about cause unlikely to be unbiased
Assuming that accidents with unreported causes follow the same statistical pattern as those with an established cause is an unwarranted assumption: assuming the reported-cause statistical pattern is what the study shows is ignoring probable clarity-bias problems, especially given that “no reported cause” is such a large percentage of all recorded accidents.
It is necessary to frame for the particular circumstances, but the sort of thing I’d expect to cause a data-bias problem in this sort of thing, is that police are going to investigate and establish a cause where it’s possibly criminal. When that applies, it means that accidents that actually are criminal (such as drunk driving) and things that could be, are far more likely to have a cause established than things where a glance at the situation makes it clear it was fallibility rather than negligence. The waters are further muddied by the fact that this isn’t even police reporting what they know: it’s also necessary to look at what choices the Amish paper is making about mentioning a cause (one might even get the opposite effect, because they are reluctant to blame or shame people).
It’s likely enough in context that there’s a bias towards what type of causes are being stated and which not, that concluding that what the study shows can be stated in statistics that ignore almost 40% of unreported cause accidents, seems to me seriously unwise unless there’s real justification for assuming there isn’t a major data bias or that it’s possible to make a reasonable estimate of what it in the actual context.
I’d argue that the likely data bias needs to be considered with respect to how the information was actually acquired, not by having “survey logic” superimposed: when you send out surveys, a different set of probable data biases needs to be taken into account from when you pull information from something like news reports.
I am not saying the 76% number of reported cause accidents being driver error is worthless – it is interesting and it has a contingent validity – but I don’t think claiming it’s what the study shows is justified.